Monday, August 12, 2013

The VEJ Tidal Torquing Model can explain many of the long-term changes in the level of solar activity.

 II. The 2300 year Hallstatt Cycle (*)
Updated and Corrected 23/08/2103

     It has long been recognized that there is a prominent 208 year de Vries (or Suess) cycle in the level of solar activity. Its appearance, however, is intermittent. Careful analysis of the Be10 and C14 ice-core records show that the de Vries cycle is most prominent during epochs that are separated by about 2300 years (Vasiliev and Dergachev, 2002).  This longer modulation period in the level of solar activity is known as the Hallstatt cycle ( Vitinsky et al., 1986Damon and Sonett, 1991Vasiliev and Dergachev, 2002).  

Summary:  

1. The VEJ tidal-Torquing model proposes that tidal bulges are formed in the base of the convective layers of the Sun by the periodically alignments of Venus and the Earth, and that it is the gravitational torque that are applied to these bulges by Jupiter that are responsible for the long-term modulation of the Solar activity cycle. Hence, it needs to be shown that the torques that are applied by Jupiter to these tidally induced bulges, naturally exhibit a 2300 year Hallstatt-like cycle.  

2. The length of the 243 year Venus transit cycle is set by the time it takes for the Earth-Venus-Sun line to re-align itself with one of the "fixed" nodes of Venus' orbit. Hence, the length of the transit cycle is determined by time it takes for the five-pointed star Venus-Earth alignment pattern to re-establish rotational symmetry plus the time it then takes for the Venus-Earth alignments to return to the "fixed" node [Note: "fixed" in this case means, roughly the same position with respect to the fixed stars].   


3. A similar strategy to that used to determine the length of the Venus transit cycle is then applied to determine the time required to precisely re-align the Jupiter torque cycle. The full length of this torque cycle includes both the time required for the realignment of the orbital position of Jupiter with respect to the Venus-Earth alignment pattern and the time required for Jupiter to re-establish its rotational symmetry pattern with respect to the fixed stars. 


4. It is shown that the Jupiter torque cycle naturally exhibits a 2302 year Hallstatt-like cycle.


(*) Note that most of the values used in this blog post are stated to four decimal places. This is not being done to claim that the values have a precision to this level of accuracy but solely for the purposes of delaying the curtailment of the number of decimal places until the end of the calculations. In addition, it is important to note that the calculation done here are just a preliminary attempt to explain why the VEJ Tidal-Torquing model produces changes in planetary torque acting upon the Sun that exhibit a Hallstatt-like cycle. A detailed analysis of ephemeris data will have to be done before these preliminary results can be confirmed.

   
The 243 year Venus Transit Cycle

Venus-Earth Alignments in a Reference Frame That is Fixed with Respect to the Stars.

     The following diagram shows five consecutive alignments of Venus and the Earth following the alignment of 2004. Each inferior conjunction of the Earth and Venus (i.e. VE alignment) is separated from the previous one by the Venus-Earth synodic cycle i.e. 1.59866 years. This means that, on average, the Earth-Venus-Sun line moves by 144.4824 degrees in retrograde direction, once every VE alignment. Hence, E-V-S line returns to almost the same orientation with respect the stars after five VE alignments or eight Earth (sidereal) years [actually 7.9933 years].


     The above figure shows that after five VE alignments (i.e 7.9933 years), the E-V-S line falls short from completing one full orbit of the Sun with respect to the stars by [(360-(360*(7.9933 - 7.0000))) =] 2.412 degrees. Hence, the E-V-S line slowly revolves about the Sun, taking 150 EV alignments (= 239.7990 years) to move backwards [clockwise in the above diagram] by one point in the five pointed star or pentagram pattern. [Note: the actual movement is 72.36 degrees over the 239.7990 years while the mean spacing between each point on the five pointed star is 72.2412 degrees]. 

     Hence, the 239.7990 year realignment symmetry for the VE alignments naturally produces a 243 year repetition time between the transits of Venus in front of the Sun. The reason for this is that the star point that is aligned with the South Node of Venus' orbit (i.e. the one pointing out of the figure above) moves one to the left after 239.7990 years, and so two extra VE alignments are required 
(along lines 4 and 5 in the above diagram) on top of the 150 VE aligns in 239.7990 years. This means that it takes 152 VE alignments = 242.9963 ~ 243 years before the Earth and Venus re-align near the South Node of Venus' orbit,  again.

[CORRECTION - (Thanks to Ulric Lyons)]
The precise re-alignment period for the VE Pentagram is actually 149.5 VE alignments of 1.59866 sidereal years = 238.9996251 sidereal years. However, since, a half VE alignment cannot give a transit of Venus across the Sun - the precise alignment occurs with Venus on the far side of the Sun. This means that transits of Venus in front of the Sun repeat at either 147 VE alignments = 235.0029759 sidereal years or 152 VE alignments = 242.9962744 sidereal years, with the latter being favored in recent times.      
   
     Technically, a complete repetition cycle of the pentagram pattern in VE alignments requires that E-V-S line revolves backwards by two star points (i.e. 144.4824 degrees) on five separate occasions. Hence, it takes 299 EV alignments (= 477.99934 years) to rotate backwards by two pentagonal star points and 1495 VE alignments (= 2389.9967 ~ 2390 years) to move backwards through the full Venus-Earth alignment pentagram pattern. 

     Hence, the VE alignment pentagram has a 2390 year Hallstatt-like symmetry re-alignment cycle with respect to the fixed stars. There raises the possibility that this 2390 year cycle could play a role in modulating any long term cycles that exist in the torque being applied by Jupiter to the VE tidal bulge. 


     However, to look for these long-term periodicities in Jupiter's torque, we need to investigate how Jupiter moves, with respect to the periodic VE tidal bulge in the convective layers of the Sun. This requires us to look at the motion of Jupiter in both a fixed frame with respect to the stars and a frame that is revolving about the Sun at the same rate as the periodic VE alignments.

Jupiter in a Reference Frame that is Fixed with Respect to the Stars

     The diagram immediately below shows the orbital position of Jupiter, starting at (0,1), every 0.79933 years, over a period of 35.9699 years [i.e. just over three orbits of the Sun]. It is clear from this diagram that, in a reference frame that is fixed with respect to the stars,  the symmetry pattern perfectly re-aligns after moves roughly 24.26 degrees in a clockwise (pro-grade) direction. It takes Jupiter 71.9397 years (i.e. just over six orbits of the Sun or 45 VE aligns) to move 23.30 degrees in a clockwise (pro-grade) direction, to approach with one degree of producing a re-alignment of rotational symmetry.


Jupiter in a Reference Frame that is Rotating with the Earth-Venus-Sun Line 

The Movement of Jupiter with Respect to the Tidal-Bulge that is Induced in the Convective Layers of the Sun by Periodic Alignments of Venus and the Earth.

     The slow revolution of the Earth-Venus-Sun alignment axis can be removed provided you place yourself in a framework that rotates by 215.5176 degrees in a pro-grade direction [with respect to the fixed stars] once every 1.59866 years. In this rotating framework, Jupiter moves in a pro-grade direction (with respect to the Earth-Venus-Sun line) by 12.9993 degrees per [inferior conjunction] VE alignment.


     The following diagram shows the position of Jupiter every VE alignment (i.e. 1.59866 years) in reference frame that is rotating with the Earth-Venus-Sun alignment line. This keeps the Earth and Venus at the 12:00 o'clock position in this diagram whenever the number of VE aligns is even and at the 6:00 o'clock position whenever the number of VE aligns is odd. In contrast, Jupiter starts out at JO and moves 12.9993 degrees every 1.59866 years, taking 11.07 years to move exactly 90 degrees in the clockwise (pro-grade) direction and 11.19 years to the position marked J7.    
    Also shown on this diagram is the position of Jupiter after 27, 28 and 29 VE alignments. This tells us that Jupiter completes exactly one orbit in the VE reference frame once every 44.28 years (= 11.07 years x 4), with the nearest VE alignment taking place at 28 VE alignments (= 44.7625 years) when Jupiter has moved 3.9796 degrees past realignment with its original position at JO.

     The following table shows how Jupiter advances by one orbit + 3.9796 degrees every 28 VE alignments until the alignment of Jupiter with the Earth-Venus-Sun line progresses forward by   
13 orbits in the VE reference frame plus 51.7345 degrees. This angle (see * in table) is almost exactly equal to the angle moved by Jupiter in 4 VE aligns (i.e. 4 x 12.99927 degrees = 51.9971 degrees). 
   
VE_multiple______Angle of______Orbits_+__Degrees   
of 12.9993_______Jupiter______________________
degrees

____ 28_________363.9796_______1__+___3.9796
____56_________727.9592_______2__+___7.9592
____84________1091.9387_______3__+__11.9387
___112________1455.9183_______4__+__15.9183
___140________1819.8979_______5__+__19.8979
___168________2183.8775_______6__+__23.8775
___196________2547.8571_______7__+__27.8571
___224________2911.8366_______8__+__31.8366
___252________3275.8162_______9__+__35.8162
___280________3639.7958______10__+__39.7958
___308________4003.7754______11__+__43.7754
___336________4367.7550______12__+__47.7550
___364________4731.7345______13__+__51.7345__*

This means that Jupiter returns to almost exact re-alignment with the Earth-Venus-Sun line after:

(364 - 4) VE aligns = 360 VE aligns = 575.5176 years 

[i.e. 12.9993 orbits of Jupiter in a retro-grade direction in the VE reference frame, falling 0.2625 degrees short of exactly 13 full orbits]

Re-aligning the Movement of Jupiter in the Rotating VE Reference Frame with its Movement in the Reference Frame that is Fixed with the Stars

    The following diagram shows the precise alignments Jupiter with the Earth-Venus-Sun line at
575.5176 years (360 VE aligns) and 1151.0352 years (720 VE aligns) in a frame of reference that is fixed with respect to the stars. Jupiter lags behind the VE alignments by 0.2654 degrees and 0.5251 degrees, respectively. 


     The next diagram (directly below) shows the precise alignments of Jupiter with the Earth-Venus-Sun line at 1726.5528 years (1080 VE aligns) and 2302.0704 years (1440 VE aligns) in a frame of reference that is fixed with respect to the stars. Jupiter lags behind the VE alignments by 0.7876 degrees and 1.0502 degrees, respectively. 


     The important point to note is that after four precise Jupiter alignments of 575.5176 years (= 2302.0704 years), the position of Jupiter advances from its initial position at JO (see the third diagram in this blog post) by 24.2983 degrees. This angle is almost exactly the same as 24.26 degrees of rotation that is required to produce a re-alignment of the rotational symmetry of Jupiter, in the reference frame that is fixed with respect to the stars.

     Hence, the period of time required for Jupiter to precisely re-align with the Earth-Venus-Sun line in a reference frame that is fixed with respect to the stars is 2302 years. This is the Hallstatt-like cycle that is naturally found in the planetary configurations that are driving the VEJ Tidal-Torquing model for solar activity.  

References

Damon, P.E. and Sonett, C.P., 1991, “Solar and terrestrial components of the atmospheric 14C variation spectrum”, in The Sun in Time, (Eds.) Sonett, C.P., Giampapa, M.S., Matthews, M.S., pp. 360–388, University of Arizona Press, Tucson.

Vasiliev, S.S. and Dergachev, V.A., 2002, “The 2400-year cycle in atmospheric radiocarbon concentration: bispectrum of 14C data over the last 8000 years”, Ann. Geophys.20, 115–120.
http://www.ann-geophys.net/20/115/2002/

Vitinsky, Y.I., Kopecky, M. and Kuklin, G.V., 1986, Statistics of Sunspot Activity (in Russian), Nauka, Moscow

Sunday, July 28, 2013

The VEJ Tidal Torquing Model can explain the long-term changes in the level of solar activity.

I. The 11 year Schwabe and 22 year Hale Cycles.

In their paper:

The influence of planetary attractions on the solar tachocline
Dirk K. Callebaut, Cornelis de Jager and Silvia Duhau
Journal of Atmospheric and Solar-Terrestrial Physics 80 (2012) 73–78

Callebaut, Jager and Duhau stated the following [my bolding below]:

"So far the study of solar variability has identified five solar periodicities with a sufficient degree of significance (cf. the review by De Jager, 2005, Chapter 11). These periods are:


  • The 11 years Schwabe cycle in the sunspot numbers. We note that this period is far from constant and varies with time, e.g. during the last century the period was closer to 10.6 years.
  • The [22  year] Hale cycles of solar magnetism encompasses two Schwabe cycles and shows the same variation over the centuries.
  • The 88 years Gleissberg cycle (cf. Peritykh and Damon, 2003). Its length varies strongly over the centuries, with peaks of about 55 and 100 years (Raspopov et al., 2004). The longer period prevailed between 1725 and 1850.
  • The De Vries (Suess) period of 203–208 years, with a fairly sharply defined cycle length.
  • The Hallstatt cycle of about 2300 years. An interesting new development (Nussbaumer et al., 2011) is the finding that Grand Minima of solar activity seem to occasionally cluster together and that there is a periodicity in that clustering. An example of such a cluster is the series of Grand Minima that occurred in the past millennium (viz. the sequence consisting of the Oort, Wolf, Sporer, Maunder and Dalton minima). This kind of clustering seems to repeat itself with the Hallstatt period."

They concluded that:

"It should be remarked in this connection that virtually none of the papers on planetary influences on solar variability succeeded in identifying these five periodicities in the planetary attractions."

and

"The challenge we face here is twofold: planetary influences should be able to reproduce at least the most fundamental of the five periodicities in solar variability, and secondly the planetary accelerations in the level of the solar dynamo should be strong enough to at least equalize or more desirably, to surpass the forces related to the working of the solar dynamo."

I believe that these statements are incorrect. In a series of posts,starting with the 11.1 year Schwabe and 22.2 year Hale cycles, I will address their first challenge by showing that the VEJ Tidal-Torquing model naturally produces all of the five periodicities that are seen in the solar data. There second challenge will be left to a later series of posts.

(N.B. Abreu et al 2012 [1] have also addressed this question by showing that the planetary torques acting on a slightly aspheric (i.e. prolate ellipsoid) tachocline layer at the base of the Sun's convective layer, produce periodicities that match those of the 88 year Gleissberg cycle, the 208 year de Vries cycle, and the 3,200 year Hallstatt cycle. However, Abreu et al. 2012 [1] model did not attempt to give an explanation for periods shorter than the 88 year Gleissberg cycle. In particular, their model does not provide a obvious explanation for the 11.1 year Schwabe and 22.3 year Hale cycles. The VEJ Tidal-torquing model is able to provide such an explanation.)   
  
[Note: if you are not familiar with the VEJ Tidal Torquing model please see: 

The Venus-Earth-Jupiter (VEJ) Tidal-Torquing Model is based upon the following set of simple principles: 

  • The dominant planetary gravitational force acting upon the outer convective layer of the Sun is that produced by Jupiter.
  •  Other than Jupiter, the two planets that apply the greatest tidal forces upon the outer convective layer of the Sun are Venus and the Earth.
  • Periodic alignments of Venus and the Earth, on the same or opposite sides of the Sun once every 0.7997 sidereal Earth years, produces temporary tidal bulges on opposite sides of the Sun's surface layers (red ellipse in the schematic diagram below).


  • Whenever these temporary tidal-bulges occur, Jupiter’s gravitational force tugs upon these tidally-induced asymmetries and either slows down or speed-up the rotation rate of plasma near the base of the convective layers of the Sun. 
  • What makes the VEJ Tidal-Torquing model intriguing, is the time period over which the Jupiter's gravitational pull speeds up and slows down the rotation rate of plasma near the base of the convective layers of the Sun, as Jupiter tugs on the tidal bulges.


[N.B. In the above diagram the planets are revolving in a clock-wise direction and the Sun is rotating in a clock-wise direction. Also, when near-side and far-side tidal bulges on the Sun's surface are referred to, it is with respect to the aligned planets Earth and Venus.]

The diagram above shows Jupiter, Earth and Venus initially aligned on the same side of the Sun (position 0). In this configuration, Jupiter does not apply any lateral torque upon the tidal bulges (The position of the near side bulge is shown by the black "0" just above the Sun's surface).  

1.5993 years later, each of the planets move to their respective position 1's. At this time, Jupiter has moved 13.000 degree ahead of the far-side tidal bulge (marked by the red 1 just above the Sun's surface) and the component of its gravitational force that is tangential to the Sun's surface tugs on the tidal bulges, slightly increasing the rotation rate of plasma at the base of the convective layers of the Sun. 

After a second 1.5993 years, each of the planets move to their respective position 2's. Now, Jupiter has moved 26.00 degrees ahead of the near-side tidal bulge (marked by the black 2 just above the Sun's surface), increasing the rotation rate at the base of the convective layers of the Sun by roughly twice the amount that occurred at the last alignment.

This pattern continues with Jupiter getting 13.000 degrees further ahead of the alternating near and far-side tidal bulges, every 1.5993 years. Eventually, Jupiter will get 90 degrees ahead of  the closest tidal bulge and it will no longer exert a net torque on these bulges that is tangential to the Sun's surface and so it will stop increasing the rotation rate of the convective layers.

Interestingly, the Jupiter's movement of 13.000 degrees per 1.5993 years with respect to closest tidal bulge, means that Jupiter will get 90 degrees ahead of the closest tidal bulge in 11.07 years. This is almost the same amount of time as to mean length of the Schwabe Sunspot cycle (11.1 +/- 1.2 years) [2], [3].

In addition, for the next 11.07 years, Jupiter will start to lag behind the closest tidal bulge by 13.000 degrees every 1.5993 years, and so its gravitational force will pull on the tidal bulges in such a way as to slow the rotation rate of the convective layers down.

All together, there will be four periods of 11.07 years, with the gravitational force of Jupiter, increasing the Sun's rotation rate over the first and third periods of 11.07 years, and decreasing the Sun's rotation rate over the second and fourth periods of 11.07 years.

Hence, the basic unit of change in the Sun's rotation rate (i.e. and increase followed by a decrease) is 2 x 11.07 years = 22.14 years. This is essentially equal to the mean length of the Hale magnetic sunspot cycle of the Sun which is 22.1 +/- 2.0 yrs) [2], [3], [4].

However, the complete planetary tidal cycle is actually (4 x 11.07 years =) 44.28 years.

And finally:
  • The equatorial convective layers of the Sun are sped-up during ODD numbered solar cycles and slowed-down during EVEN numbered solar cycles [3]. This could provide a possible explanation for the Gnevyshev−Ohl (G−O) Rule for the Sun [5].
  • We proposed that it is the resultant variations in the rotation rate of the lower layers of the Sun's convective zone, produced by the planetary tidal-torquing of Venus, the Earth and Jupiter, that modulate the Babcock-Leighton solar dynamo. Hence, we claim that it is this modulation mechanism that is responsible for the observed long-term changes in the overall level of solar activity. In addition, this mechanism may be responsible for the torsional oscillations that are observed in the Sun's convective layer, as well.
References

[1] Abreu J. A., Beer J., Ferriz-Mas A., McCracken K.G., and Steinhilber F. Is there a planetary influence on solar activity? Astron & Astrophys., 2012, 548, A88 
[5]  Ian R. G. Wilson, Do Periodic Peaks in the Planetary Tidal Forces Acting Upon the Sun Influence the Sunspot Cycle? The General Science Journal, 2010. 


Tuesday, July 23, 2013

IS THIS A PLANETARY SIGNATURE IN OUR CLIMATE SYSTEM?


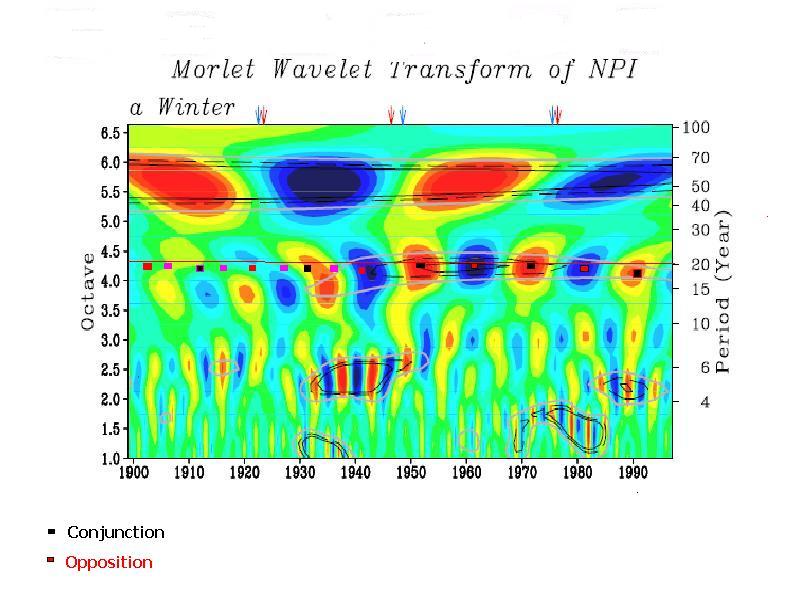
The diagram below shows a Morlet Wavelet Transform of the winter (North Pacific Index) NPI index.
The North Pacific (NP) Index is the area-weighted sea level pressure over the region 30°N-65°N, 160°E-140°W. The NP index is defined to measure interannual to decadal variations in the atmospheric circulation. 


Reference: Shoshiro Minobe
GEOPHYSICAL RESEARCH LETTERS, VOL. 26, No. 7, Pages 855-858, APRIL, 1, 1999
Resonance in bidecadal and pentadecadal climate oscillations over the North Pacific: Role in climatic regime shifts

Superimposed on this plot are the times of Jupiter-Saturn Conjunction (when these two planets are on opposite sides of the Sun) which are spaced by 19.86 years, and the times of Jupiter-Saturn Opposition (when the two planets are aligned on the same side of the Sun), also spaced by 19.86 years. 

This result is supported by a comparable figure from:

ADVANCES IN ATMOSPHERIC SCIENCES, VOL. 20, NO. 5, 2003, PP. 694–710 694
Joint Propagating Patterns of SST and SLP Anomalies in the
North Pacific on Bidecadal and Pentadecadal Timescales
ZHU Yimin and YANG Xiuqun


What we see in these figures is a remarkable match between the phase and period of Jupiter-Saturn conjunctions and oppositions and the bi-decade cycle in the winter NPI index. This match is best between the years of 1947 and 1991.

It is also apparent that groups of three bi-decadal cycle in the Winter NPI index are nested in phase inside a penta-decadal cycle of roughly 55 years in length. You can see one complete penta-decadal cycle starting with a Jupiter-Saturn opposition in 1922 and ending three Jupiter-Saturn oppositions later in 1981.

Amazingly, the Sun's motion about the Barycentre (i.e. center-of-mass) of the Solar System undergoes one orbital loop from one Jupiter-Saturn conjunction (or opposition) to the next  every 19.86 years. Each orbital loop of the Sun about the Barycentre rotates by roughly 120 degrees with respect to the stars, compared to its previous orbital loop. Hence, it takes three orbital loops (i.e 3 x 19.86 = 59.6 years) for the Sun's Barycentric motion to rotate once with respect to the stars.

This means that solar inertial motion (SIM) about the Barycentre mimics the three bi-decadal cycles nested [in-phase] inside a longer penta-decadal cycle. The synchronization between these two phenomenon is quite remarkable and suggests that there may be an underlying physical link.


Wednesday, July 3, 2013

Scientific Publications and Presentations

UPDATED 11/08/2013

The following is a list of my recent scientific publications
and presentations. I am placing the list on my blog so that
others can have easy access.

2013

Wilson, I.R.G., Long-Term Lunar Atmospheric Tides in the 
Southern Hemisphere, The Open Atmospheric Science Journal,
2013, 7, 51-76

http://www.benthamscience.com/open/toascj/articles/V007/TOASCJ130415001.pdf

Wilson, I.R.G., 2013, Are Global Mean Temperatures 
Significantly Affected by Long-Term Lunar Atmospheric 
Tides? Energy & Environment, Vol 24,
No. 3 & 4, pp. 497 - 508

http://multi-science.metapress.com/content/03n7mtr482x0r288/?p=e4bc1fd3b6e14fd8ab83a6df24c8a72d&pi=11


Wilson, I.R.G., 2013, Personal Submission to the Senate 
Committee on Recent Trends in and Preparedness for 
Extreme Weather Events, Submission No. 106

http://www.aph.gov.au/parliamentary_business/committees/senate_committees?url=ec_ctte/completed_inquiries/2010-13/extreme_weather/submissions.htm

2012

Wilson, I.R.G.Lunar Tides and the Long-Term Variation 
of the Peak Latitude Anomaly of the Summer Sub-Tropical 
High Pressure Ridge over Eastern Australia
The Open Atmospheric Science Journal, 2012, 6, 49-60


Wilson, I.R.G., Changes in the Earth's Rotation in relation 
to the Barycenter and climatic effect.  Recent Global Changes 
of the Natural Environment. Vol. 3, Factors of Recent 
Global Changes. – M.: Scientific World, 2012. – 78 p. [In Russian].

This paper is the Russian translation of my 2011 paper
Are Changes in the Earth’s Rotation Rate Externally 
Driven and Do They Affect Climate? 
The General Science Journal, Dec 2011, 3811.

2011

Wilson, I.R.G., 2011, Are Changes in the Earth’s Rotation 
Rate Externally Driven and Do They Affect Climate? 
The General Science Journal, Dec 2011, 3811.


Wilson, I.R.G., 2011, Do Periodic peaks in the Planetary Tidal 
Forces Acting Upon the Sun Influence the Sunspot Cycle? 
The General Science Journal, Dec 2011, 3812.

http://gsjournal.net/Science-Journals/Essays/View/3812

[Note: This paper was actually written by October-November 2007 and submitted to the New Astronomy (peer-reviewed) Journal in early 2008 where it was rejected for publication. It was resubmitted to the (peer-reviewed) PASP Journal in 2009 where it was again rejected. The paper was eventually published in the (non-peer reviewed) General Science Journal in 2010.]

2010

N. Sidorenkov, I.R.G. Wilson and A.I. Kchlystov, 2009, The 
decadal variations in the geophysical processes and the 
asymmetries in the solar motion about the barycentre. 
Geophysical Research Abstracts Vol. 12, EGU2010-9559, 
2010. EGU General Assembly 2010 © Author(s) 2010

2009


Wilson, Ian R.G., 2009, Can We Predict the Next Indian 
Mega-Famine?, Energy and Environment, Vol 20, 
Numbers 1-2, pp. 11-24.

http://multi-science.metapress.com/content/a15v07801838k763/


El Ninos and Extreme Proxigean Spring Tides

A lecture by Ian Wilson at the Natural Climate Change
Symposium in Melbourne on June 17th 2009.

2008

Wilson, I.R.G., Carter, B.D., and Waite, I.A., 2008
Does a Spin-Orbit Coupling Between the Sun and the 
Jovian Planets Govern the Solar Cycle?,
Publications of the Astronomical Society of Australia
2008, 25, 85 – 93.

  
N.S. Sidorenkov, Ian WilsonThe decadal fluctuations 
in the Earth’s rotation and in the climate characteristics
In: Proceedings of the "Journees 2008 Systemes de reference 
spatio-temporels", M. Soffel and N. Capitaine (eds.), 
Lohrmann-Observatorium and Observatoire de Paris. 
2009, pp. 174-177 
  

Which Came First? - The Chicken or the Egg?

A Presentation to the 2008 Annual General Meeting of the
Lavoisier Society by Ian Wilson

http://www.lavoisier.com.au/articles/greenhouse-science/solar-cycles/IanwilsonForum2008.pdf

2006


Wilson, I. R. G., 2006, Possible Evidence of the 
De Vries, Gleissberg and Hale Cycles in the Sun’s 
Barycentric Motion, Australian Institute of Physics 17th
National Congress 2006, Brisbane, 3rd -8th December 
2006 (No longer available on the web)


Sunday, June 23, 2013

Are the Dansgaard-Oeschger (D-O) Warm Events driven by Lunar Tides?


What are Dansgaard-Oeschger (D-O) Warm Events ?

D-O warm events are abrupt increases in temperature to near-inter-glacial conditions that occurred during the last Ice-Age. These temperature increases occurred in a matter of decades and they were quickly followed by a period of gradual cooling.


                 Reference:

What are some possible explanations for the D-O Events?

#    Two types of explanations have been advanced:

           a) periodic external forcing
           b) internal oscillations within the climate system.

#     If the 1,470 year cycles originate within the Earth system, we would also expect the period to change as the background moves from full glacial to inter-glacial conditions.

#     In contrast, orbital cycles are highly regular and so they would not be expected to change between glacial and inter-glacial conditions. 

               Reference:
Some Important Conclusions about D-O Events

§ The D-O events are discrete events paced by a regular cycle of 1470 years.

§ The five most recent events, arguably the best dated, have a standard deviation of only 32 years (2 %) about a 1470 year spacing.

§ This level of precision points to the orbital cycle explanation.

§ The 1,832 Lunar tidal cycle proposed by Keeling and Whorf (1998) cannot be reconciled with the 1,470 year spacing found in the Greenland ice-core data.

§ The origin of the regular pacing of this phenomenon remains a mystery. 

             Reference:

Are D-O Events Still Present in the Holocene?


Yes! They are called Bond Events and the next 
D-O/Bond Event should begin about 2150 A.D.! 

Reference: Bond et. al. SCIENCE , VOL. 278,  14 NOVEMBER 1997 A Pervasive Millennial-Scale Cycle in North Atlantic Holocene and Glacial Climates

So if the 1832 year cycle in the ABSOLUTE lunar tidal strength does not appear to provide the right external synchronization time needed for the 1470 year D-O Events, can the Lunar tides still play a role ?

The answer is yes, if we are prepared to make a paradigm shift!   

What happens if instead of looking for cycles in the absolute strength of lunar tides, we look for cycles in the strength of the lunar tides that are synchronized with the seasons?

        This means that if we start out with a New Moon (i.e. Syzygy - when the Earth, Moon and Sun are aligned) at closest Perigee (i.e. when the Moon is closest to the Earth) at the time of Perihelion (i.e. when the Earth is closest to the Sun) on or about January  1st, how long does it take before the New Moon returns to the same precise alignment with the seasons?  

In order to answer this question we need to consider a few definitions: 

§ One Full Moon Cycle (FMC) is the time required for the point of Perigee in the Lunar orbit to re-align with the Sun.

§ As the Earth revolves around the Sun, the Line-of-Apsides very slowly turns in a clock-wise direction. This motion is caused by the precession of the Line-of-Apsides of the Lunar orbit around the Earth, once every 8.8502 Sidereal years, as measured with respect to the stars.  It is known as the Cycle of Lunar Perigee.

§ The Perigee-Syzygy-Perihelion Cycle is the time required for a Full (or New Moon) at Perigee to re-occur at or very near to the time of Perihelion.

       The Perigee-Syzygy-Perihelion Cycle is one lunar tidal cycle that is known to precisely realign with the seasons.

§ This cycle repeats itself at the following times:

0.00 FMC=0.00 Tropical yrs=New Moon at Perigee & Perihelion
27.5 FMC=31.00 Tropical yrs=Full Moon at Perigee & Perihelion
55.0 FMC=62.01 Tropical yrs=New Moon at Perigee & near Perihelion
82.5 FMC=93.01 Tropical yrs=Full Moon at Perigee & near Perihelion
157.0 FMC=177.00 Tropical yrs=New Moon at Perigee & at Perihelion

        The realignment of Perigee with the Sun on January 1st resets itself with respect to the stars once every:

157.00 FMC’s = 177.00 Tropical years.

This happens because:

157 x FMC   = 176.999 Sidereal years
20 x 8.8502 = 177.004 Sidereal years

         What happens when we extend the 177.00 year Perigee-Perihelion Cycle over longer time periods?

§ The following plot shows the Earth’s position in its orbit when it is ≤  seven days from the 1st of January near Perihelion.
§ All FMC's (where Perigee either points directly at the Sun or directly away) are shown  up to 354 (= 2 x 177.00 ) years.
§ The FMC's that are separated from their predecessor by 9.0 years are shown in the  same colour.
§ The FMC's in the sequence 31, 208, 385…. years are extended until the Perigee- Perihelion cycle is almost precisely reset after 916.00 years.
§ Of course, this is only half of the Full reset cycle since the perigee points directly at the Sun at 0.00 years and it points directly away from the Sun after 916.00 years.
§ Hence, the full reset time for the Perigee-Perihelion cycle is 1832.00 years.  This the famous Keeling & Whorf 1800 year tidal cycle.


The next graph re-plots the data in the previous graph to show how the proximity of a given FMC event  is to Perihelion changes over time.

Note: The strongest lunar tides occur when the FMCs occurs at or very near to Perihelion, once every 177 years. These times are marked in the following diagram with vertical arrows.

How do the phases of the Moon re-synchronize 
with the 177.0 year Perigee-Perihelion Cycle?

§ When the Perigee of the Lunar Orbit is pointing at the Sun at (or very near to) Perihelion it does not necessarily mean that the phase of the Moon is either New or Full (Syzygy).

§ The next slide shows the number days that the phase of the Moon is from being New or Full, for each of the FMC's that are at (or near to) Perihelion. The graph starts out with a New Moon at Perigee on January 1st (near to Perihelion on January 3rd) in the year 0.00.

§ New or Full Moons that re-occur for FMC's at (or near to) Perihelion that are whole multiples of 739 years (i.e. 0.0, 739.0, 1478.0 and 2217.0 years) after the starting date, always occur at lunar Perigee.

§ In contrast, New and Full Moons that re-occur for FMCs at (or near to) Perihelion half way between whole multiple of 739 years (i.e. 370, 1109 and 1848 years) always occur at lunar Apogee.

§ Hence, we end up with the following 739.0 year repetition sequence for the times where FMC's are at Perihelion:

                            0.00 Years  è New or Full Moon at Perigee
                        184.75 Years  è First or Last Quarter Moon
                        369.50 Years  è New or Full Moon at Apogee
                        554.25 Years  è First or Last Quarter Moon
                        739.00 Years  è New or Full Moon at Perigee

§ Careful study of the New and Full Moons near 739.0 years shows that the strongest alignment between the phases of the Moon and the 177.0 year Perigee-Perihelion cycle occurs at the FULL MOON at 739.001 years. This contrasts with the NEW MOON at 0.000 years.

§ What this is telling us is that it actually takes 1478.00 years (= 2 x 739.00 years) to complete the cycle with a New Moon at Perigee when a FMC is close to Perihelion once again.

§ The FMC cycle is closest to perihelion at ((1447+1478)/2) years = 1462.5 years, while the lunar phases are most closely aligned with the Perigee-Perihelion cycle at 1478 years – producing a best synchronization at roughly (1478+1462.5)/2 = 1470.3 years.

§This is in extremely good agreement with the measured spacing of the D-O climate warming events of 1470 years!


         Hence, if we look for cycles in the strength of the lunar tides that are synchronized with the seasons, rather than cycles in the absolute strength of lunar tides, we find that there is a natural 1470 year tidal cycle.

This supports the contention that Dansgaard-Oeschger (D-O) Warm Events are being driven by a 1470 year periodicity in the long-term Lunar Tides!