Thursday, November 13, 2014

Evidence that Strong El Nino Events are Triggered by the Moon - IV

IV. The triggering mechanism for El Niños: The alignment of the lunar line-of-apse with the equinoxes and Solstices of the Earth's orbit.

THIS IS  THE COVER POST FOR THIS STUDY

1. A SUMMARY OF THE THREE PREVIOUS POSTS

If you are unfamiliar with this topic you may wish to read the following three post in order to understand
this current covering post.

Evidence that El Niño Events are triggered by the Moon  - I
I . The Changing Aspect of the Lunar Orbit and its Impact Upon the Earth's Length of Day (LOD).

Evidence that El Niño Events are triggered by the Moon - II
II. Seasonal Peak Tides - The 31/62 year Perigee-Syzygy  Tidal Cycle.

Evidence that El Niño Events are triggered by the Moon - III
III. Strong El Niño Events Between 1865 and 2014.

     Observations of the Earth rate of spin (i.e. LOD) show that there are abrupt decreases in the Earth's rotation rate of the order of a millisecond that take place roughly once every 13.7 days. These slow downs in spin occur whenever the oceanic (and atmospheric) tidal bulge is dragged across the Earth's equator by the Moon. They are produced by the conservation of total angular momentum of the Earth, its oceans and its atmosphere.

     An investigation in the earlier posts revealed that:

a) The lunar distance during its passage across the Earth's Equator determined the size of the (13.7 day) peaks in LOD (i.e. the magnitude of the periodic slow-downs in the rate of the Earth's rotation).

b) The relative sizes of consecutive peaks in LOD were determined by the slow precession of the lunar line-of-apse with respect to the stars, once every 8.85 years.

c)  In the years where the lunar line-of-apse were closely aligned with the Solstices, the ratio of the peaks in LOD were close to 1.0 and in the years where the lunar line-of-apse were closely aligned with the Equinoxes, the ratio of the peaks in LOD were far from 1.0 (i.e. near either 0.5 or 2.0).


   These series of posts are based upon the premise that El Niño events are triggered by a mechanism that is related to the relative strength of consecutive peaks in the Earth's LOD (corresponding to decreases in the Earth's rotation rate) at the same point in the seasonal calendar.

[N.B. A description of how El Niño events are actually triggered by this mechanism is left to a future paper that will be submitted to a journal for peer-review.]

     If this premise is valid, then we should expect to see a pattern in the sequencing of El Niño events that matches that of the 31/62 year Perigee-Syzygy lunar tidal cycle. This particular long-term tidal cycle synchronizes the slow precession of the lunar line-of-apse [which governs the slow change in the Moon's distance as it crosses the Equator] with the Synodic cycle (i.e the Moon's phases) and the seasons. 

   This study covers all the strong El Niño events between 1865 and 2014. A detailed investigation of the precise alignments between the lunar synodic [lunar phase] cycle and the 31/62 year Perigee-Syzygy cycle, over the time period considered, shows that it naturally breaks up six 31 year epochs each of which has a distinctly different tidal property. The second 31 year interval starts with the
precise alignment on the 15th of April 1870 with the subsequent epoch boundaries occurring every 31 years after that:

Epoch 1 - Prior to 15th April  1870
Epoch 2 - 15th April 1870 to 18th April 1901
Epoch 3 - 8th April 1901 to 20th April 1932
Epoch 4 - 20th April 1932 to 23rd April 1963
Epoch 5 - 23rd April 1963 to 25th April 1994
Epoch 6 - 25th April 1994 to 27th April 2025


     Hence, if the 31/62 year seasonal tidal cycle plays a significant role in sequencing the triggering of El Niñevents it would be reasonable to expect that its effects for the following three epochs:

New Moon Epoch:
Epoch 1 - Prior to 15th April  1870
Epoch 3 - 8th April 1901 to 20th April 1932
Epoch 5 - 23rd April 1963 to 25th April 1994

[That have peak seasonal tides that are dominated by new moons that are predominately in the northern hemisphere]


should be noticeably different to its effects for these three epochs:

Full Moon Epochs:
Epoch 2 - 15th April 1870 to 18th April 1901
Epoch 4 - 20th April 1932 to 23rd April 1963
Epoch 6 - 25th April 1994 to 27th April 2025

[That have peak seasonal tides that are dominated by full moons that are predominately in the southern hemisphere] 

2. Evidence that the Moon Triggers El Niño Events

     Figure 1 shows the (mean) absolute difference in lunar distance between consecutive transits of the Earth's equator, versus the (mean) longitude of the lunar line-of-apse.

     Each of the 65 data point in figure 1 represents a six month time interval, with the intervals arranged sequentially across a period that extends from June 1870 to Nov 1902. The 32 year time period chosen is assumed to be reasonably representative of the 149 year period of this study, which
extends from 1865 to 2014. [N.B. All of the data points shown in figure 1 are obtained by
averaging the plotted values over a six month time interval.]

     Shown along the bottom of figure 1 are the months in which the longitude of the lunar line-of-apse aligns with the Sun. This tells us that the line-of-apse aligns with the Sun at the Equinoxes when its longitudes are 0 [March] and 180 [September] degrees, and it aligns with the Sun at the Solstices when its longitudes are 90 [June] and 270 [December] degrees.

Figure 1


[N.B. The mean longitude of the lunar line-of-apse (averaged over a six month period) moves from left to right across the diagram at roughly 20.34 degrees every six months. This means that it takes 8.85 years (the Cycle of Lunar Perigee) in order to cross the diagram from far left to far right.]

     Figure 1 shows that if you were to randomly select a sample of six month time intervals during the years from 1865 to 2014, you would expect that they should (by and large) be evenly distributed along the sinusoidal shown in this plot.

     Indeed, if you apply a chi squared test to the data in figure 1, based upon the null hypothesis that there is no difference between number of points within +/- 45 degrees of the time where the lunar line-of-apse aligns with the Sun at the Equinoxes, compared to the number of points within +/- 45 degrees of the time where the lunar line-of-apse aligns with the Sun at the Solstices, then you find that:

+/- 45 deg. Solstices________33 points
+/- 45 deg Equinoxes_______32 points

expected value = 32.5
total number of points n = 65
degrees of freedom = 1
chi squared =  0.015
and p = 0.902

This means that we are (most emphatically) unable to reject this null hypothesis.

El Niño Events During the Full Moon Epochs 

     Figure 2 shows the corresponding plot for all the El Niño events that are in the Full Moon epochs
of the 31/62 year Perigee/Syzygy tidal cycle i.e.

Full Moon Epochs:
Epoch 2 - 15th April 1870 to 18th April 1901
Epoch 4 - 20th April 1932 to 23rd April 1963
Epoch 6 - 25th April 1994 to 27th April 2025
   
Figure 2


      As with figure 1, if you apply a chi squared test to the data in figure 2, based upon the null hypothesis that there is no difference between number of points within +/- 45 degrees of the time here the lunar line-of-apse aligns with the Sun at the Equinoxes, compared to the number of points within +/- 45 degrees of the time where the lunar line-of-apse aligns with the Sun at the Solstices,
then you find that:

+/- 45 deg. Solstices________2 points
+/- 45 deg Equinoxes_______11 points

expected value = 6.5
total number of points n = 13
degrees of freedom = 1
chi squared =  6.231
and p = 0.013

     This tells us that we can reject the null hypothesis.

     Hence,we can conclude that there is a highly significant difference between number of points within +/- 45 degrees of the time where the lunar line-of-apse aligns with the Sun at the Equinoxes, compared to the number of points within +/- 45 degrees of the time where the lunar line-of-apse aligns with the Sun at the Solstices. The difference is such that the El Niño events in the Full Moon epochs preferentially occur near times when the lunar line-of-apse aligns with the Sun at the times of the Equinoxes.

     It is obvious, however, that the robustness of this claim of significance is not very strong, simply because of the small sample size. Indeed, it would only take two extra data points in the +/- 45 deg. Solstices bin to render the result scientifically insignificant [i.e. a chi squared of 3.267 and a probability of rejecting the null hypothesis of 0.071]. Ideally, you would like to have at least double the sample size before you would be a little more confident about the final result.

El Nino Events During the New Moon Epochs 

   Figure 3 shows the corresponding plot for all the El Niño events that are in the New Moon epochs
of the 31/62 year Perigee/Syzygy tidal cycle i.e.

New Moon Epoch:
Epoch 1 - Prior to 15th April  1870
Epoch 3 - 8th April 1901 to 20th April 1932
Epoch 5 - 23rd April 1963 to 25th April 1994

Figure 3


As with figure 1, if you apply a chi squared test to the data in figure 3, based upon the null hypothesis that there is no difference between number of points within +/- 45 degrees of the time where the lunar line-of-apse aligns with the Sun at the Equinoxes, compared to the number of points within +/- 45 degrees of the time where the lunar line-of-apse aligns with the Sun at the Solstices, then you find that:

+/- 45 deg. Solstices________9 points
+/- 45 deg Equinoxes_______4 points

expected value = 6.5
total number of points n = 13
degrees of freedom = 1
chi squared =  1.923
and p = 0.166

     This tells us that we are unable to reject the null hypothesis. However, the El Niño event that has a mean longitude for the lunar line-of-apse of 135.45 degrees in figure 3 could technically be placed in +/- 45 deg. Solstices bin changing the chi squared to 3.769 and the probability of rejecting the null hypothesis to the scientifically significant value of p = 0.052.

     Hence,we can conclude that there is a marginally significant difference between number of points
within +/- 45 degrees of the time where the lunar line-of-apse aligns with the Sun at the Equinoxes,
compared to the number of points within +/- 45 degrees of the time where the lunar line-of-apse aligns with the Sun at the Solstices. The difference is such that the El Niño events in the New Moon epochs preferentially occur near times when the lunar line-of-apse aligns with the Sun at the times of the Solstices.

    However, just like the El Niño events in the Full Moon epochs, it is obvious that the robustness of this claim of significance is not very strong, simply because of the small sample size.

Comparing  El Niño Events in the Full Moon Epochs with those in the New Moon Epochs.

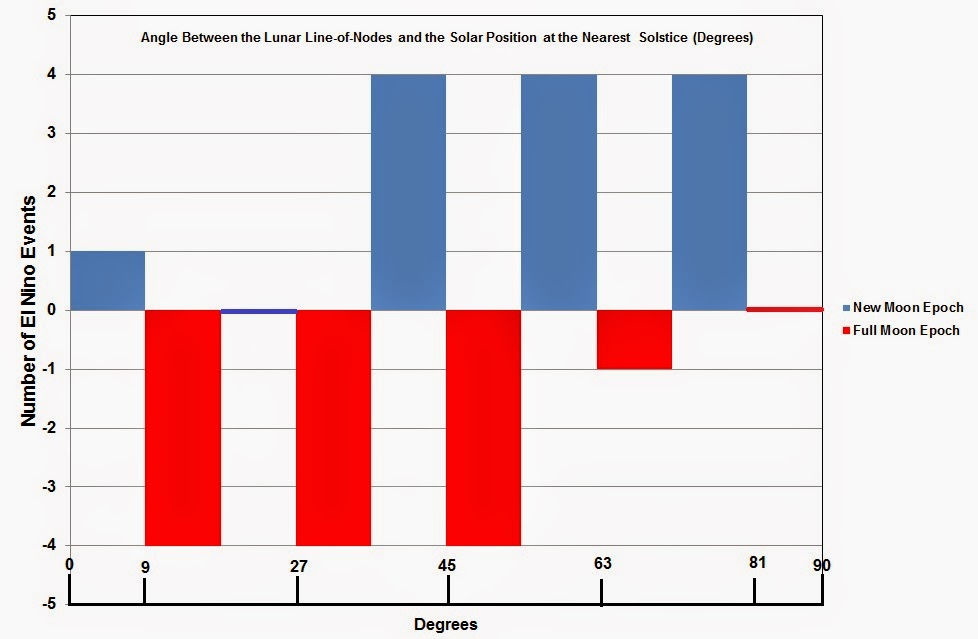
      Figure 4 shows a histogram of the angle between the lunar line-of-nodes and the position of the nearest solstice for all of the 26 El Niño events in the study sample. This angle, by definition, lies between 0 and 90 degrees.

     The El Niño events have been divided into two sub-samples, consisting of those that are in the New Moon Epochs and those that are in the Full Moon epochs.
   
Figure 4


     The question is, are the angles between the lunar line-of-nodes and the position of the nearest 
Solstice for the two sub-samples drawn from the same parent population (= null hypothesis).

    This can be tested by doing a two-tailed 
Wilcoxon Rank-Sum Test that compares the two sub samples.

     If we define the New Moon epoch El Ni
ños as sample A and the Full Moon epoch El Niños as sample B, we get:

n(A) =13

n(b) = 13
w(A) = 236
Mu(A) = 175.5
sigma(A) = 19.5

and z = (W(A) - Mu(A))/Sigma(A)
            = 3.103

For a two-tailed solution this means that we reject  the null hypothesis at the level of p = 0.002 - 
which is highly significant. 

Hence, since we can say from our earlier results that: El Niño events in the Full Moon epochs 
preferentially occur near times when the lunar line-of-apse aligns with the Sun at the times of the Equinoxes.

We can now also say that: El Niño events in the New Moon epochs must preferentially avoid times when the lunar line-of-apse aligns with the Sun at the Equinoxes.

FINAL COMMENTS:

This study is still a work in progress but already we can make some interesting predictions, which
if fulfilled would reinforce the claim that El Nino events are triggered by the Moon.

The first prediction is that because we are currently in a 31 year Full Moon Epoch for El Niño events,
there should be heightened probability of experiencing a strong El Niño in the following years:

2015-2016  (see figure 1)
2019-2020 and 
2024 

as these are the years where the lunar line-of-apse aligns with the Sun at the times of the Equinoxes.

The second prediction is that, starting sometime around the year 2021, we should begin to see El Niño events that are more typical of the sequencing seen for the New Moon Epochs (i.e. they will be triggered when the line-of-apse aligns with the Sun at the times of the Solstices). These times could include:

2022-23 (?) and 
2027

 Of course, there is always the caveat that we are currently moving into an extended period of low solar activity which could increase the overall intensity of El Niño events out to at least the mid 2030's. However, this could also be accompanied by a decrease in the frequency of occurrence of El Niño events as we move into a period of misalignment between the lunar line-of-nodes and the lunar line-of-apse. 

Wednesday, November 12, 2014

Evidence that Strong El Nino Events are Triggered by the Moon - III

III. Strong El Nino Events Between 1865 and 2014.

     There are two primary indicators that can be used to
determine if the ENSO climate system is experiencing
an El Nino event.

a) The Southern Oscillation Index (SOI)

     The first indicator is an atmospheric based metric
called the Southern Oscillation Index (SOI). The
Australian Bureau of Meteorology (BOM) defines the
SOI as being the standardised anomaly of the monthly
Mean Sea Level Pressure (MSLP) difference between
Tahiti and Darwin, such that :

SOI = 10  x (Pdiff - [Pdiff])
                  SD(Pdiff)

where
Pdiff      = [Monthly Tahiti MSLP] - [Monthly Darwin MSLP]
[Pdiff]   = the long-term average of Pdiff for the month.
SD(Pdiff) = the long-term standard deviation of Pdiff for 
                    the month. [The climatology period used is 
                    from 1933 to 1992]

and the symbols [ and ] are used to indicate that an 
average is being taken of the parameter in question.

Using the Australian BOM's convention, SOI values
range from -35 to + 35. El Nino conditions are considered
to be present if the SOI drops below -8 for a sustained
period of time.

Ref: http://www.bom.gov.au/climate/glossary/soi.shtml

b)  The Nino 3.4 SST Index or Oceanic Nino Index (ONI)

     The second indicator is a sea-surface temperature
(SST) based metric called the Nino 3.4 SST Index or
the Oceanic Nino Index. It relies upon SST anomalies
in a region of the equatorial Pacific ocean between
120 and 170 degree W longitude and -5 to +5 degree
latitude.

     El Nino conditions are considered to be present if the
three month running mean of SST anomalies in the Nino
3.4 region have five consecutive months that exceed 0.5
C. [Note: The climatology period for this particular
index are based upon NOAA Extended Reconstruction
Sea Surface Temperatures ( i.e. ERSST.v3 SSTs) that
use the base period 1971 - 2000].

Ref: http://www.ncdc.noaa.gov/teleconnections/enso/indicators/sst.php


c) The Bivariate EnSo Time Series (or BEST) Index

     The El Nino is part of a coupled oceanic and atmospheric 
phenomenon known as the ENSO. The Nino 3.4 SST 
anomaly index is normally used to determine if El Nino
conditions exist in the eastern and central equatorial 
Pacific Ocean. However, its sole use neglects atmospheric
processes. A better index would be one that effectively 
combines the information from the Nino 3.4 SST anomaly 
index with that from the SOI index, which does include 
atmospheric processes that are involved in establishment 
and maintenance of El Nino events.

     Smith and Sardeshmukh [2000] have created a
Bivariate EnSo Time Series (BEST) index that effectively
combines the atmospheric component of the ENSO (i.e. 
the SOI index) with the oceanic component (i.e Nino 3.4 SST 
anomaly index).

Ref: Smith, C.A. and P. Sardeshmukh, 2000, 
The Effect of ENSO on the Intraseasonal 
Variance of Surface Temperature in Winter.,
International J. of Climatology20 1543-1557.

Ref: http://www.esrl.noaa.gov/psd/people/cathy.smith/best/

[N.B. The SOI index is taken from Phil Jones at the Climate
Research Unit (CRU) of East Anglia which is defined slightly
differently to that used by the Australian BOM. In addition,
the SST data used is the Met Office Hadley Centre's sea 
ice and SST data set known as HadISST1.] 

Ref: http://www.cru.uea.ac.uk/cru/data/pci.htm

     The first step in the creation of BEST index is to remove 
the monthly mean climatology for the period 1898 - 2000
from both indices. After that the values are standardized
by the month so that each month has a mean of 0 and a 
standard deviation of 1.0 for all years during the output 
time period. Next, the resulting SST and SOI values are
averaged for each month of the time series. Finally, either
 a 3 or 5 month running mean is applied to both time series.

Ref: http://www.esrl.noaa.gov/psd/people/cathy.smith/best/details.html

     Smith and Sardeshmukh (2000) present a table that lists all of the 
months where the SST index exceeds 1.28 standard deviations 
above the mean for that given month AND the SOI index exceeds 
1.28 standard deviations below the mean for that given month as 
well. These months are determined from data that cover the years 
from 1871 to 2014 and which have had a five month running mean 
applied.  

      In addition, Smith and Sardeshmukh (2000) present a slightly 
less stringent list of El Nino months (covering the period from 1
871 to 2014) that uses 0.96 standard deviation cut-off rather than
1.28.

Ref: http://www.esrl.noaa.gov/psd/people/cathy.smith/best/
Ref: http://www.esrl.noaa.gov/psd/people/cathy.smith/best/table33.txt

     There is a possibility that some of the weaker El Nino
events could be triggered by stochastic processes within the
ENSO climate system. Under these circumstances, it would 
be prudent to:

a) use Smith and Sardeshmukh's less stringent criteria to 
    ensure that we have as many El Nino events as possible, 
    to ensure that we have adequate statistics for our analysis. 

b) limit our sample to the those El Nino events that last
     for more than three months to weed out the marginal 
     or weak events that could be triggered by these  
    stochastic processes.  

     Hence, the El Nino events sample that is adopted for
this series of posts uses the less stringent selection criteria
and only includes those El Nino events that last longer 
than three months.

d) The El Nino Events Sample

Table 1 shows all of the El Nino Events that meet
our selection criteria that occurred between 1871
and 2014.

                                   Table 1
_________________________Mean___Mean
_______Starting__Decimal__Delta___Apse
_Year___Month___Year__Distance__Angle

Supplement to Table 1


N.B. The information in columns four and five
         will be used in blog post IV.

Columns one and two show the starting
year and month of each strong El Nino event.

Column three shows the decimal year of the start
of the El Nino event.

Column four shows the mean difference in lunar
distance (in kilometres) between consecutive
crossings of the Earth's equator averaged over
a period of six months centred on the beginning
of the starting month of the El Nino event.

Ref: Walker J.: Lunar Perigee and Apogee Calculator, 
1997, available on-line at: 
http://www.fourmilab.ch/earthview/pacalc.html,

Column five shows the mean angle of longitude
of the lunar line-of-apse averaged over a period
of six months centred on the beginning of the
starting month of the El Nino event.    

Ref: Ray, R.D. and Cartwright, D.E.: Times of 
peak astronomical tides, Geophys. J. Int., 168, 
999–1004, 2007.

The El Nino events that have an (*) in column 2
are those events that just fall short of our selection
criterion because they only last for three months.
They have been included in Table 1 for completeness.

e) Extending the sample to events prior to 1871

A data set that extends the SOI index back to 1866
is available for download from the NOAA site at:

http://www.esrl.noaa.gov/psd/gcos_wgsp/Timeseries/SOI/

This time series shows that there was a strong El Nino
event that started around January 1868. Data for this
event has been added as a supplement to Table 1.

f) El Nino Event Near the Epoch Boundaries

The strong El Nino event for 1905 appears to
be a continuation of the ~ 9 year spacing pattern
for El Nino events that is evident in epoch 2 ( i.e.
1896 to 1905), even though it crosses over into
very beginning of epoch 3 (which starts on the
18th of April 1901).

In like manner, the moderately strong El Nino
event for 1993 occurs just at the end of epoch
5, even though it appears to be an extension of
the ~ 9 year spacing pattern that is evident in
epoch 6 (1993 to 2002).

As a consequence, both of these boundary El Nino
events have been move into the adjacent tidal epochs
where they better match the commonly observed
9 (and sometimes 4.5) year spacing.


Tuesday, November 11, 2014

Evidence that Strong El Nino Events are Triggered by the Moon - II


II. Seasonal Peak Tides - The 31/62 year Perigee-Syzygy
     Tidal Cycle.

     In part I it was established that:

a) The lunar distance during its passage across the Earth's
     Equator determined the size of the (13.7 day) peaks in
     LOD (i.e. the magnitude of the periodic slow-downs in
     the rate of the Earth's rotation).

b) The relative sizes of consecutive peaks in LOD were
     determined by the slow precession of the lunar
     line-of-apse with respect to the stars, once every 8.85
     years.

c)  In the years where the lunar line-of-apse were closely
     aligned with the Solstices, the ratio of the peaks in LOD
     were close to 1.0 and in the years where the lunar
     line-of-apse were closely aligned with the Equinoxes, the
     ratio of the peaks in LOD were far from 1.0 (i.e. near
     either 0.5 or 2.0).

     This raise the question: Is there a lunar tidal cycle that
synchronizes the slow precession of the lunar line-of-apse
[which governs the lunar distance as the Moon crosses the
Equator] with the Synodic cycle (i.e the Moon's phases)
and the seasons? If there is, then it is clear that the
repetition period for such a long-term tidal cycle would
determine the time required for the largest (13.7 day)
peaks in LOD to reoccur, at the same point within the
seasonal calendar.

     The is such a cycle and it is called the 31/62 year 
Perigee-Syzygy Cycle. This tidal cycle is the time required
for a full (or new moon) at Perigee to re-occur at or very
near to the same point in the seasonal calendar.

     However, additional (background) information is
needed in order to fully understand  why this is the
case. This information will cover the following topics:

a) Perigean Spring Tides
b) The 8.85 year Cycle of Lunar Perigee and
c) The Full Moon Cycle (FMC)
d) The 20.293 year Perigee-Syzygy Cycle

A. The Perigean Spring Tides

     The phases of the Moon are caused by the fact the Moon
goes around the Earth once with respect to the Sun roughly
once every 29.53 days. Whenever the Moon, Earth and Sun are
lined up at New or Full Moon (i.e. syzygy) they produce
higher-than-normal variations in the heights of the tides that
are known as Spring Tides.

      The point in the Moon's orbit where the Moon is closest to
the Earth is known as Perigee, and the point where it is furthest
is known as Apogee. The line joining these two points is known
as the Line-of-Apse of the lunar orbit (see figure 1).

Figure 1


      Spring tides are strengthened when a Full or New Moon 
occurs at Perigee. This happens when the lunar line-of-apse 
is pointing at (or directly away from) the Sun. These stronger 
than normal Spring Tides are known as Perigean Spring Tides 
(see figure 2).

Figure 2


Perigean spring tides reoccur roughly once every 206
days (or once every 0.5 FMC - see below).

B. The 8.85 year Cycle of Lunar Perigee

     As the Earth revolves around the Sun, the line-of-apse 
slowly turns in a pro-grade direction (i.e. clockwise direction
in the figures shown in this post). This motion is caused by 
the precession of the line-of-apse of the lunar orbit about the 
Earth, once every 8.8501 sidereal years, as measured with 
respect to the stars. It is known as the Cycle of Lunar Perigee.

C. The Full Moon Cycle (FMC)

    The following five figures show the Earth moving in a 
clock-wise direction about the Sun. Figure 3a shows the 
location of the Earth in its orbit on January 1st. Superimposed 
upon the image of the Earth is an arrow showing the direction 
of the lunar line-of-apse – N.B. Perigee is pointing toward 
the Sun.

     As the Earth revolves around the Sun, the line-of-apse 
slowly precesses in a clock-wise direction. Figures 3b, 3c, 
3d, and 3e, show the position of the Earth and the lunar 
line-of-apse after 0.25, 0.50, 0.75 and 1.00 FMC, respectively.
   
Figure 3a


Figure 3b


Figure 3c


Figure 3d


Figure 3e


One Full Moon Cycle has passed after the 
Perigean-end of the line-of-apse points 
towards the Sun once again. Figure 3e 
shows that:

1.0 FMC = 411.78 days = 1.1274 tropical years

D. The 20.293 Perigee-Syzygy Cycle

If you have a new or full moon at closest
perigee (i.e. ~ 357,000 km) then it will again
be at closest perigee 20.293 years later. The
reason for this is that:


18 FMC  = 251 Synodic Months 
               = 269 Anomalistic Months 
               = 20.293 Tropical Years


Now the 20.293 year Perigee-Syzygy cycle
will realign with the seasons after:

(3 x 18 FMC)     + 1.0 FMC    = 55 FMC

(3 x 20.293 yrs) + 1.2174 yrs  = 62.006 yrs

Hence, it is this re-alignment that produces the 31/62 year 
Perigee-Syzygy seasonal tidal cycle.

E. The 31/62 Year Perigee-Syzygy Seasonal Tidal Cycle


     Alternatively, it is possible to see the 31/62 year
Perigee-Syzygy seasonal cycle as a realignment of the FMC 
with the seasonal calender. Figure 4 explains why this is the 
case.

Figure 4


     If we start out with the conditions shown in
figure 3a i.e the Earth at its January 1st position 
in its orbit and the perigee end of the lunar 
line-of-apse is pointing at the Sun, after 5.5 
FMC the perigee end of the lunar line-of-apse 
will be pointing directly away from the Sun 
and the Earth will have moved 6.2 orbits. This 
means that after five of these time intervals i.e.

5 x 5.50 FMC       = 27.5 FMC 
5 x 6.20086 years = 31.003 tropical years

the Earth will again be located at its January 1st
orbital position but with the perigee end of the lunar
line-of-apse pointing directly away from the Sun.

     Of course, to return to the original configuration
seen in figure 3a, with the perigee end of the lunar 
line-of-apse pointing directly towards the 
Sun, it will take twice as long i.e. 62.006 years. 

Figure 5 shows how the FMC and 20.293 year 
Perigee-Syzygy cycle are linked together and
how they re-synchronize with the seasons to
produce the 31/62 year Perigee-Syzygy seasonal 
tidal cycle. 

Figure 5


     The top part of figure 5 shows that if you start out
with a new moon at closest perigee, 20.293 years
(18 FMC) later you will get another new moon
at closest perigee. However, after 10.71 years (9.5
FMC) you have a Full Moon at closest perigee that
will also reoccur after 31.00 years (27.5 FMC),
achieving re-alignment with the seasonal calender.

     Again, it takes two of these 31 year time intervals
(i.e. 62.00 years = 55 FMC) to return a new moon at
closest perigee at the same point in the seasonal
calender.

F.  What are the Implications for the Triggering of 
      El Nino Events?

     The 31/62 year Lunar Perigee/Syzygy Seasonal tidal
cycle is the one that synchronizes the slow precession of
the lunar line-of-apse [which governs the distance of the
Moon as it crosses the Earth's Equator] with the Moon's
phases and with the seasons.

     Hence, if El Nino events are triggered by a phenomenon
that is associated with the abrupt slow downs in the Earth's
rotation rate once every 13.7 days, you might expect that
the 31/62 year seasonal tidal cycle would be evident in the
sequencing of the El Nino events.

     This study covers all the strong El Nino events between
1865 and 2014. A detailed investigation of the precise
alignments between the lunar synodic [lunar phase] cycle
and the 31/62 year Perigee-Syzygy cycle, over the time
period considered, shows that it naturally breaks-up
into six 31 year epochs each of which has a distinctly
different tidal property. The second 31 year interval
starts with the precise alignment on the 15th of April
1870 with the subsequent epoch boundaries occurring
every 31 years after that. :

Epoch 1 - Prior to 15th April  1870
Epoch 2 - 15th April 1870 to 18th April 1901
Epoch 3 - 8th April 1901 to 20th April 1932
Epoch 4 - 20th April 1932 to 23rd April 1963
Epoch 5 - 23rd April 1963 to 25th April 1994
Epoch 6 - 25th April 1994 to 27th April 2025

     The following discussion uses Epochs 2 and 3 to highlight
the reasons why each of these 31 year epochs have distinctly
different tidal properties.

     Figure 6 shows all of the tidal events between the 15th
of April 1870 and the 18th of April 1901 where a new of full
moon occurred within +/- 2.5 hours of Perigee. In essence,
this diagram shows the strongest two or three tidal events in
any given month of the year, over the full 31 year epoch.

[NOTE: It is important to recognize that the pattern that
 is seen for the strongest tidal events is representative of
 what is happening with the underlying weaker tidal events
 as well.]

     Figure 6 shows that in epoch 2, the strongest tidal events
between April and November are full moons, while those
between December and March are new moons. In addition,
it turns out that almost all of these strong tidal events (both
new and full moon) occur in the southern hemisphere.

     The pattern that is seen in the seasonal peak tidal events
in epoch 2 (i.e. in figure 6) are also repeated in epochs 4
and 6.
       
Figure 6


      Figure 7 shows all of the tidal events between the 18th
of April 19010 and the 20th of April 1932 where a new of full
moon occurred within +/- 2.5 hours of Perigee. As with figure
6, this diagram shows the strongest two or three tidal events in
any given month of the year, over the full 31 year epoch.

     Figure 6 shows that in epoch 3, the strongest tidal events
between April and November are new moons, while those
between December and March are full moons. In addition,
it turns out that almost all of these strong tidal events (both
new and full moon) occur in the northern hemisphere.

     The pattern that is seen in the seasonal peak tidal events
in epoch 3 (i.e. in figure 7) are also repeated in epochs 1
and 5.

Figure 7


     Hence, you would expect that the distinctly different tidal
properties for the 31 year epochs 1, 3, and 5 compared to the
31 year epochs 2, 4 and 6 should be evident in the sequencing
of El Nino events over the period from 1865 to the present.

      Thus, if the 31/62 year seasonal tidal cycle plays a
significant role in sequencing the triggering of El Nino events
it would be reasonable to expect that its effects for the
following three epochs:

New Moon Epoch:
Epoch 1 - Prior to 15th April  1870
Epoch 3 - 8th April 1901 to 20th April 1932
Epoch 5 - 23rd April 1963 to 25th April 1994

[That have peak seasonal tides that are dominated
  by new moons that are predominately in the
  northern hemisphere]

should be noticeably different to its effects for these
three epochs:

Full Moon Epochs:
Epoch 2 - 15th April 1870 to 18th April 1901
Epoch 4 - 20th April 1932 to 23rd April 1963
Epoch 6 - 25th April 1994 to 27th April 2025

[That have peak seasonal tides that are dominated by
  full moons that are predominately in the southern
  hemisphere] 

Monday, November 10, 2014

Evidence that Strong El Nino Events are Triggered by the Moon - I

This blog post is the first of a series of four posts that are designed to show that the strongest El Niño
events are triggered by the Moon.

This series of posts will provide evidence that will eventually be used in a peer-reviewed paper that
will discuss the properties of the lunar orbit that are potentially responsible for the onset of El Niño events.

The five blog posts will cover the following topics:

I.  The Changing Aspect of the Lunar Orbit and its impact Upon the Earth's Length of Day (LOD).

II. Seasonal Peak Tides - The 31/62 year Perigee-Syzygy Tidal Cycle.

III. The Sample - Strong El Niños between 1865 and 2014.

IV. The triggering mechanism for El Niños: The alignment of the lunar line-of-apse with the Equinoxes and Solstices of the Earth's orbit.

Plus -  Predictions for the Future - The 2015/2016 El Nino and more.

I.  The Changing Aspect of the Lunar Orbit and its Impact Upon the Earth's Length of Day (LOD).

a. Inter-Annual Changes in the Earth's LOD

     The blue curves in figures 1a, 1b, and 1c (below) show the Earth's LOD over a six year period from January 1966 through to December 1971.  These plots use daily LOD values that are available online from the International Rotation and Earth Reference System Service (IERS) covering the period from January 1962 until the present. This data can downloaded at:

http://datacenter.iers.org/eop/-/somos/5Rgv/latest/214

     It is evident from these three figures that there are abrupt periodic slow downs in the Earth's rotation rate (corresponding to an increase in LOD) once every 13.7 days that are accompanied by much smoother longer-term changes in LOD that are associated with the annual seasonal cycle (red curves).

     The smoother longer-term seasonal variations in LOD are primarily the result of changes in the angular momentum of the Earth that are a response to the slow (north-south) seasonal movement of the Earth's atmosphere and its wind patterns.

Figure 1a


Figure 1b

Figure 1c


     A very crude attempt has been made in figures 1a, 1b, and 1c, to remove the longer-term seasonal component from the LOD measurements. This has been done by calculating the running median and standard deviation for a +15/-14 day time interval about a point and then subtracting 1.3 times the
standard deviation from that median. The resulting red curve (which has been smoothed by a 6th order binomial filter) has then been subtracted from the blue LOD curve to produce the de-trended LOD (green) curve.

     Having removed the longer-term seasonal changes in LOD, we are left with the abrupt slow downs in the Earth's rotation rate (roughly) once every 13.7 days. More detailed investigations show that the spikes in LOD occur within a day or two of the time that the Moon crosses the Earth's Equator. This tells you that the slow down in the rotation rate is a direct result of the lunar tidal bulge in the Earth's oceans (and atmosphere) being dragged across the Earth's Equator by the Moon. The slow down occurs for much the same reason that a twirling ice-skater slows down their rate of spin by extending their arms i.e. by the conservation of angular momentum.

     A more detailed comparison of the tidally induced peaks in LOD in figures 1a, 1b and 1c shows that in early 1966 (figure 1a) the peaks in LOD associated with transits of the Moon across the Equator from the northern to the southern hemisphere, are roughly twice as large as the next peaks in LOD (13.7 days later) that are associated with transits of the Moon across the Equator from the southern to the northern hemisphere. By the first three months of 1969 (figure 1b), the consecutive peaks in LOD are almost equal in size. And finally, bye late 1971 (figure 1c), the peaks in LOD that are associated with transits of the Moon across the Equator from the southern to the northern hemisphere, are roughly twice as large as the next peaks in LOD (13.7 days later) that are associated with transits of the Moon across the Equator from the northern to the southern hemisphere.

b. Factors That Influence the Slow Changes in the Ratio of the Consecutive Peaks in LOD.

     The reason for the slowly changing ratios of consecutive peaks in LOD with time is evident from figures 2, 3 and 4.

Figure 2 shows the ratio of the size of consecutive peaks in LOD for the years 1962 to 1987.

Figure 2


Figure 3 shows the ratio of consecutive peaks in LOD versus lunar distance (in kilometres) for the numerator of the ratio, for the years from 1966 to 1971.

Figure 3


Figure 4 shows the size of the LOD peaks versus lunar distance (in kilometres), for the years from 1966 to 1971.

Figure 4


     Figure 4 indicates that the size of the peaks in LOD (seen in figures 1a, 1b, and 1c) are primarily determined by the Moon's distance from the Earth as it crosses the Equator.

     Figures 2 and 3 indicate that whenever the ratio of consecutive peaks in LOD is close to 1.0, the distance of the Moon from the Earth at consecutive transit crossings of the Equator are close to the
Moon's average distance from the Earth of approximately 380,000 km. However, whenever the ratio of consecutive peaks in LOD is far from 1.0 (i.e. either 2.0 or 0.5), the distance of the Moon from the Earth at one transit crossing is at the distance of closest approach (i.e. the distance of lunar perigee = 356,000 km), and the distance of the Moon at the other transit crossing is at its furthest from the Earth (i.e the distance of lunar apogee = 407,000 km).

    Hence, it is evident from these figures that main factor that governs the size of the peaks in LOD seen in figures 1a, 1b and 1c, is the distance of the Moon from the Earth, at the time of its transit across the Equator. Similarly, these figures show that the slow change in the relative size of consecutive peaks in LOD are primarily driven by the slow drift of the lunar line-of-apse with respect to the stars. That is, whenever the Perigean end of the lunar line-of-apse aligns with the Sun at or near the time of the June or December Solstice (i.e. on the 21st of June or the 21 st of December), the ratio of the peaks in LOD is close to 1.0. However, whenever the perigee end of the lunar line-of-apse aligns with the Sun at or near the time of the March or September Equinoxes (i.e. on the 21st of march or the 21 st of September), the ratio of the peaks in LOD is either close to 0.5 or close to 2.0.

    In order to highlight this latter point, the times at which the Perigean end of the lunar line-of-apse aligns with the Equinoxes (i.e. in March and September) and the times at which it aligns with the Solstices (i.e. in December and June) are marked along the bottom of figure 2. These markers show that the relative size of consecutive peaks in LOD are determined by the slow 8.85 year drift of the lunar line-of-apse with respect to the stars.

[Note: It is clear from figure 2 that the relative size  of consecutive peaks in LOD are also affected by the slow  drift in the tilt of the lunar orbit with respect to the plane  of the ecliptic, over the 18.6 year Draconic cycle.  In the preliminary analysis presented here, this secondary modulation is ignored, although it will be discussed in the peer-reviewed paper that is based upon these series of posts.]
  
c. Conclusions

 In part I it has been established that:

a) The distance of the Moon from the Earth during its passage across the Earth's Equator determines the size of the 13.7 day peaks in LOD (i.e. the periodic slow-downs in the rate of the Earth's rotation).

b) The relative sizes of consecutive peaks in LOD are determined by the slow precession of the lunar line-of-apse with respect to the stars, once every 8.85 years.

c)  In the years where the lunar line-of-apse are closely aligned with the Solstices, the ratio of the peaks in LOD are close to 1.0 and in the years where the lunar line-of-apse were closely aligned with the Equinoxes, the ratio of the peaks in LOD were far from 1.0 (i.e. either at 0.5 or 2.0).

d. Using a Proxy to Extending the Analysis to Dates Prior to 1962.

     This study will be investigating El Nino events as far back as 1868. Unfortunately, there is little good quality daily LOD data prior to 1962, so a proxy is needed for the ratio in peaks of LOD prior to this date.

Figure 5 


     One such proxy, that is useful for keeping track of the relative orientation of the lunar line-of-apse compared to the Solstices and the Equinoxes is shown in figure 5. This plot shows the difference in lunar distance between consecutive transits of the Equator between the years 1962 and 1976. Superimposed upon this graph are the years in which the lunar line-of-apse is aligned with the Solstices and the Equinoxes. A comparison with figure 2 shows that this quantity is an excellent proxy for this parameter,