Monday, June 2, 2014

What is the Australian Bureau of Meteorology Trying to Hide?


The Moon's orbit is tilted by approximately five degrees compared to the Earth-Sun plane. The net affect of this is that the strength of Lunar-tides at a given latitude on the Earth's surface vary in strength over a cycle of 18.6 years. This 18.6 year Draconic cycle is also clearly evident in the small changes that take place in the rate of rotation of the Earth.

The above graph clearly shows that Victoria experienced increased annual precipitation around 1917, (1936), 1955, 1973-74, 1992, and 2010-11. These years are separated by ~ 18.6 years and occur at times which correspond to peaks in the strength of the Draconic tides.

Why is the Australian BOM ignoring this obvious piece of evidence that connects the annual rainfall in Victoria to long-term changes in the Lunar Tides?

Will they be ready for the next period of increased precipitation around 2029?

Please refer to the following papers for a possible explanation of this phenomenon:

Wilson, I.R.G.Lunar Tides and the Long-Term Variation 
of the Peak Latitude Anomaly of the Summer Sub-Tropical 
High Pressure Ridge over Eastern Australia
The Open Atmospheric Science Journal, 2012, 6, 49-60


Wilson, I.R.G., Long-Term Lunar Atmospheric Tides in the 
Southern Hemisphere, The Open Atmospheric Science Journal,
2013, 7, 51-76

http://www.benthamscience.com/open/toascj/articles/V007/TOASCJ130415001.pdf

Thursday, May 8, 2014

El Nino Events are Caused by Extreme Perigean Spring Tides

The Y-axis of the two graphs below show the number of minutes
that a New or Full Moon occured from Lunar perigee while the
X-axis shows the number of days that the lunar event occurred
after April 1st [There is no April Fool joke here].

The graphs show all of the most extreme Perigean Spring-Tide
events that occurred between 1800 and 1987. The lower a
tidal event appears in these two graphs and the closer a tidal
event is to Perihelion on January 3 rd [i..e. day 278 on the
X-axis] the greater its tidal strength. This means that the
relative strength of the extreme Perigean Spring Tides
becomes strong as you move from the upper-left of these
two graphs to the lower right.

The top figure shows all of the extreme Perigean
Spring-Tidal events that occur either one year prior to,
or in the starting year of, a recognized El Nino event.

The bottom figure shows all of the extreme Perigean
Spring-Tidal events that DO NOT occur either one
year prior to, or in the starting year of, a recognized
El Nino event.


A close comparison of these two figures clearly shows
that the strongest extreme Perigean Spring-Tidal events
are preferentially found either one year prior to, or in the
starting year of, a recognized El-Nino event.

Hence, this data supports the contention that strong
tides produced by extreme Perigean Spring-Tides play
an important role in instigating these influential climate
events.

You might want to read the following related post as
well:

http://astroclimateconnection.blogspot.com.au/2013/02/do-you-think-that-moon-might-have.html

Tuesday, January 14, 2014

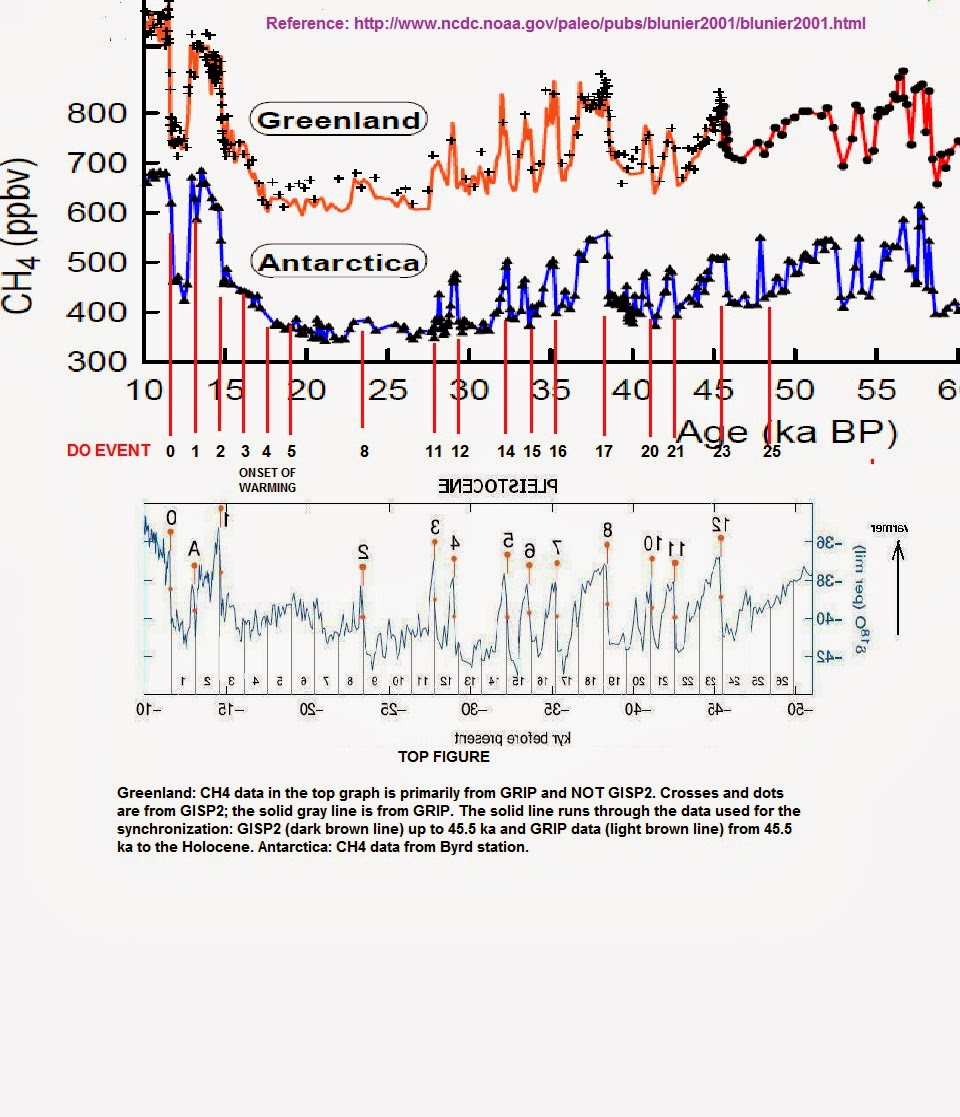
DO Events Cause Rapid Warming Events in the Last Glacial Period

Here is my evidence that DO [Dansgaard-Oeschger] events are
associated with rapid warming periods in the glacial record.

The the top figure in the graph below uses the GRIP chronology
from 0 to 45,000 BP.

http://www.ncdc.noaa.gov/paleo/pubs/blunier2001/blunier2001.html


There is some controversy about the GISP2, GRIP and NGRIP
scaling chronologies for the Greenland ice core. Shown below
are the timing of DO events 0, 2, 8, 11, 12, and 13 using the latest
NGRIP-based Greenland Ice Core Chronology 2005 (GICC05)
time scale to the period between 14.9 – 32.45 ka b2k (before
A.D. 2000) [Thanks to Rodger Andrews for pointing this out].


Reference:  http://www.isogklima.ku.dk/english/publications/papers/pdfs/244.pdf

Note that DO events 0, 2, 8, 11, 12, and 13 have been placed
on this new scale.

Wednesday, January 8, 2014

The Long-Term Periodicities of the VEJ Spin-Orbit Coupling Model

The reader should be familiar with the contents of the
following paper before continuing with this post:

Wilson I.R.G., The Venus–Earth–Jupiter spin–orbit 
coupling model, Pattern Recogn. Phys., 1, 147–158,
2013

which can be freely downloaded at:
http://www.pattern-recogn-phys.net/1/147/2013/prp-1-147-2013.html

In this paper, Wilson (2013) constructs a Venus–Earth
–Jupiter spin–orbit coupling model from a combination
of the Venus–Earth–Jupiter tidal-torquing model and
the gear effect. The new model produces net tangential
torques that act upon the outer convective layers of the
Sun with periodicities that match many of the long-term
cycles that are found in the 10Be and 14C proxy records
of solar activity.

Wilson (2013) showed that there are at least two 
ways that the Jovian and Terrestrial planets can 
influence bulk motions in the convective layers 
of the Sun. 

The first is via the VEJ tidal-torquing process:

– Tidal bulges are formed at the base of the convective
layers of the Sun by the periodical alignments of Venus
and the Earth.

– Jupiter applies a tangential gravitational torque to these
tidal bulges that either speed-up or slow-down parts of
the convective layer of the Sun.

– Jupiter’s net tangential torque increases the rotation rate
of the convective layers of the Sun for 11.07 yr (seven
Venus–Earth alignments lasting 11.19 yr) and then
decreases the rotation rate over the next 11.07 yr.

– The model produces periodic changes in rotation rate
of the convective layers of the Sun that result a 22.14 yr
(Hale-like) modulation of the solar activity cycle ( 14
Venus–Earth alignments lasting 22.38 yr).

– There is a long-term modulation of the net torque that
is equal to the mean time required for the 11.8622 yr
periodic change in Jupiter’s distance from the Sun to
realign with the 11.0683 yr tidal-torquing cycle of the
VEJ model.

The second way is via modulation of the VEJ 
tidal-torquing process via the gear effect:

The gear effect modulates the changes in rotation rate of
the outer convective layers of the Sun that are being
driven by the VEJ tidal-torquing effect.

– This modulation is greatest whenever Saturn is in
quadrature with Jupiter. These periodic changes in the
modulation of the rotation rate vary over a 19.859 yr
period.

– The gear effect is most effective at the times when Venus
and the Earth are aligned on the same side of the Sun.

– There is a long-term modulation of the net torque that
has a period of 192.98 yr.

Note: The sidereal orbital periods used in this post are
those provided by:
http://nssdc.gsfc.nasa.gov/planetary/planetfact.html

 = sidereal orbital period of Venus = 0.615187(1) yrs


= sidereal orbital period of the Earth = 1.000000 yrs


= sidereal orbital period of Jupiter = 11.8617755(6) yrs


= sidereal orbital period of Saturn = 29.45663 yrs


= synodic period of Venus/Earth = 1.59866(5) yrs


= synodic period Jupiter/Saturn = 19.8585(3) yrs


The Physical Meaning for each of the Periodicities

The 22.136 Year Period of the VEJ Tidal-Torquing Model 

This is the time over which the angle between the nearest
VE tidal bulge (formed in the convective layers of the Sun)
and Jupiter moves from 0 to 180 degrees

Jupiter's net tangential torque increases the rotation rate of
the Sun's convective layers for the first 11.068 years and
then decreases the rotation rate for the remaining 11.068
years.

Hence, the basic unit of change in the Sun’s rotation rate
(i.e. an increase followed by a decrease in rotation rate)
is 2 × 11.068 yr = 22.137 yr. This is essentially equal
to the mean length of the Hale magnetic sunspot cycle of
the Sun, which is 22.1 ± 2.0 yr (Wilson, 2011).

The 22.136 year period is simply half the realignment
time between Venus, the Earth and Jupiter (= 44.272
years) and it can be represented by the equation:


(Paul Vaughan - private communications).

The 165.42 year Modulation Period of the
Net Tangential Torque of Jupiter 

The 11.068 year period in the net tangential torque of
Jupiter acting upon the base of the Sun's convective
layer is modulated by the 11.862 year variation in the
mean distance of Jupiter from the Sun. This produces
a 165.42 year modulation in Jupiter's peak net tangential
torque given by:


The 193.02 year Modulation Period of the Gear Effect

The is the time required for the 22.137 yr periodicity of the
net tangential torque of Jupiter associated with the VEJ
Tidal-Torquing model to re-align with the 19.859 yr period
associated with the gear effect:


which can also be written as;


linking this modulation cycle to a multiple of the
period of time required for the planets Venus, the Earth,
Jupiter and Saturn to re-synchronize their orbits.

The 88 Year Gleissberg Cycle

The 88 year Gleissberg Cycle is a well identified
long-term periodicity that is seen in the level of solar
activity. The following equation shows that is merely
the synodic beat period between half the synodic
period of Jupiter/Saturn (= 9.9293 yrs) and seven
time the synodic period of Venus/Earth = 11.191 yrs.

Half the synodic period of Jupiter/Saturn is the time
between successive quadratures of Jupiter and Saturn
which is the main periodicity of the gear effect, while
seven times the synodic period of Venus/Earth
is the periodicity of the link between the VEJ
tidal-torquing model and the gear effect.


Of course, multiples of the Gleissberg period
correspond to long-term periodicities that were found
by McCracken et al. [2012]:

1 x 88.09 = 88.09 yrs --> 87.3 ± 0.4 yrs
4 x 88.09 = 352.36 yrs --> 350 ± 0.7 yrs
6 x 88.09 = 528.54 yrs --> 510 ± 15 yrs
8 x 88.09 = 704.72 yrs --> 708 ± 28 yrs

7 x 165.42 yrs = 6 x 193.02 yrs ≈ 1158 yrs

The following formula are direct consequence of
the above commensurablity:


The last equation links the orbital periods Venus and
the Earth to those of Jupiter and Saturn.

Sunday, December 15, 2013

Variations in the Earth's Climate on Decadal Time Scales and Proxigean Spring Tides

Richard Ray (2007) has made the bold claim that:

"Occasional extreme tides caused by unusually favorable alignments of the moon and sun are unlikely to influence decadal climate, since these tides are of short duration and, in fact, are barely larger than the typical spring tide near lunar perigee."

This post sets out to show that this claim is not completely true.

Richard Ray and David Cartwright (2007) have calculated the strengths and dates of the maximal lunar-solar tidal potentials over the period from 1 to 3000 A.D.  Thankfully, Prof. Ray has kindly made this data available upon request. The following arguments are based upon this data set which is known as the Ray-Cartwright Table.

Figure 1 below shows the total equilibrium ocean tides (T) caused by the lunar-solar tides between the years 2000 and 2010 A.D i.e.

T = (Vtot)/g

where Vtot is the total tidal potential due to the Sun and Moon, g is the acceleration due to gravity (= 9.82 m/s/s) and T is in cm.

Note: The terms "equilibrium ocean tide" and "tidal  potential" are used interchangeably in this post, however, both refer to the equilibrium ocean tide heights measured  in cm.

Figure 1


From figure 1 we can see that:

a) The total lunar-solar tidal potential (Vtot - green curve) is the sum of the lunar tidal potential (Vlun - red curve) and the solar tidal potential (Vsol - blue curve).

b) Vsol peaks once every year when the Earth is at or near perihelion (blue curve).

c) The largest values of Vlun occur whenever the subtended angle of the Sun and Moon (as seen from the Earth's centre) is either less than 9 degrees (i.e. close to New Moon) or greater than 171 degrees (i.e. close to Full Moon). This means that the largest values of Vlun occur very close to each New and Full Moon where they produce the Spring Tides (red curve).

d) The largest values of Vlun peak roughly once every 206 days when the spring tides occur at perigee. These tides are known as Perigean Spring Tides. The 206 year period is associated with the changing angle between the lunar line-of-apse and the Earth-Sun direction. This angle is determined by the combined motion of the Earth about the Sun and the precession of the lunar line-of-apse. The lunar line-of-apse takes 411.78 days to re-align with Earth-Sun line [note: 411.78/2 = 205.89 days].

e) Vtot (i.e. Vlun + Vsol - green curve) varies up and down between 55 and 62 centimetres once every every 206 days.

Hence, first impressions indicate that Ray (2007) and Ray and Cartwright (2007) correctly concluded that if you compare peak Perigean spring tides with typical Perigean spring tide that are adjacent in time, there is little or no difference in their relative strength on decadal time scales [e.g. compare  Perigean spring tides with total potentials that are greater than 60 cm in figure 1].

However, Ray (2007) and Ray and Cartwright (2007) have missed one important detail. The problem with their simple analysis is that it does not take into account the different ways in which the lunar tides can interact with the Earth’s climate system.

The most significant large-scale systematic variations upon the Earth's climate on an inter-annual to decadal time scale, are those caused by the annual seasons. These variations are predominantly driven by changes in the level of solar insolation with latitude that are produced by the effects of the Earth's
obliquity and its annual motion around the Sun.

This raises the possibility that the lunar tides act in "resonance" with (i.e. subordinate to) the atmospheric changes caused by the far more dominant solar driven seasonal cycles. With this type of
simple “resonance” model, it is not so much in what times do the lunar tides reach their maximum strength, but whether or not there are peaks in their strengths that re-occur at the same time within the annual seasonal cycle.

A good analogy is a child on a swing. If you consider the annual seasons as being the equivalent of the child on the swing as they slowly move back and forward then the lunar tides can be thought of as the hand of the person who pushes the swing. Clearly, the hand pushing the swing is most effective in imparting energy to the child on the swing if they give a push at the highest point of their motion. Similarly, peak lunar tides should have their greatest impact upon the seasonal swings of the climate system if they are applied at a specific point in the seasonal cycle e.g. the summer or winter solstices.

Figure 2 shows all of the total tidal potentials listed in the Ray-Cartwright Table that occur in the month of January between the years 1900 and 2010 A.D.

Figure 2


It is immediately evident from figure 2 that simply limiting the total tidal potentials to those that affect the Earth's climate system in January produces significant variations in the total tidal potential
on decadal time scales. Figure 2 shows that the peak equilibrium ocean tide (or total tidal potential) varies by +/- 7 %  either side of its mean peak value of 59 cm on a time scale of 4.425 years.

Note: The repetition cycle of 4.425 years is simply half the  time required for the lunar line-of-apse to precess once around Earth with respect to the stars. 

Even greater decadal variations in the total tidal potential are produced if we differentiate between those that occur at New Moon in January (Figure 3) from those that occur at Full Moon in January (Figure 4).

Figure 3

Figure 3 shows that the peak equilibrium ocean tide (or total tidal potential) at New Moon vary by +/- 13.5 %  either side of theirmean peak value of 55.5 cm, on a time scale of 8.85 years.

Figure 4


While figure 4 shows that the peak equilibrium ocean tide (or total tidal potential) at Full Moon vary bu the same amount over the same time scale of 8.85 years. However, the peak tidal potentials are shifted in phase by 180 degrees (equivalent to 4.425 years).

The effect of lunar phase on the magnitude of monthly variation in the total tidal potential on decadal time scales must be accounted for because at times near summer/winter solstice i.e. during the months of December or January and June or July, the tides induced by spring tides at New and Full Moon affect distinctly different parts of the planet.

Figure 5 shows the latitude of the sub-lunar point on the Earth's surface for each of the tidal potentials produced by the (near) New and (near) Full Moons that are displayed in figures 3 and 4.

Figure 5


We see that in figure 5 that the latitude of the sub-lunar points of all of the New Moons on the Earth's surface are between about 13 and 28 degrees South while the sub-lunar points of all of the Full Moons on the Earth's surface are between about 12 and 29 degrees North.

Note: Figure 5 shows that a clear 18.6 year sinusoidal variation in the latitude of the sub-lunar points tales place in each hemisphere. 

One way to correct the tidal potentials for the substantial differences in latitude between New and Full Moon is to multiply each potential by the cosine of the difference in latitude between its sub-lunar point and 23.5 degrees South. This give the approximate vertical tidal potential for each New and Full Moon event at a latitude of 23.5 degrees South (on the Earth's surface).

Figure 6


Figure 6 shows that the total equilibrium ocean tide corrected to a latitude of 23.5 degrees South. We can see from this figure that the tidal potentials at New Moon dominate total tidal potential. This means that the peak total equilibrium ocean tide (or peak total tidal potential) varies by +/- 13.5 %  either side of its mean peak value of 55.5 cm, on a time scale of 8.85 years.

Note: All the claims that are made in this post by the author also applies if the interaction window between the lunar tides and the Earth's climate occurs over a three month (seasonal) time period centred upon the winter solstice (May-Jun-Jul) or the summer solstice (Nov-Dec-Jan).

Hence, the claim by Richard Ray (2007) that:

"Occasional extreme tides caused by unusually favorable alignments of the moon and sun are 
unlikely to influence decadal climate, since these tides are of short duration and, in fact, are barely larger than the typical spring tide near lunar perigee."

is not completely true. 

Indeed if, as is most likely, the interaction between the lunar tides and Earth's climate primarily takes place over a monthly to season window then it clear from the above post that the total tidal potential can vary by at least +/- 13.5 %  either side of its mean peak value of 55.5 cm, on a time scale of 8.85 years.

Addendum

Richard Ray(2007) also claimed that because of the short duration of each tidal event:

"A more plausible connection between tides and near-decadal climate is through “harmonic beating”
of nearby tidal spectral lines. The 18.6-yr modulation of diurnal tides is the most likely to be  detectable."

Note: Richard Ray is referring to the beat period  between the lunar Draconic month and the lunar 
Sidereal month known as the nodal period of lunar  precession:

(27.321661547 x 27.212220817)  = 6793.2277480 days

(27.321661547 - 27.212220817)
                                                      = 18.599 sidereal years

This claim may be partly true.

REFERENCES

Ray, R.D., 2007, Decadal Climate Variability: Is 
There a Tidal Connection?, J. Climate20, 3542–3560.

Ray, R.D. and Cartwright, D. E., 2007, Times of peak astronomical
tides, Geophys. J. Int. (2007) 168, 999–1004